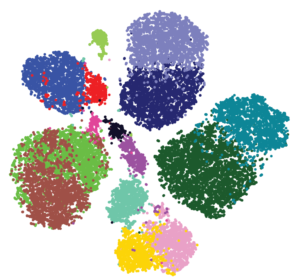
Example of data clustered using the phenograph clustering method, which is based on t-SNE analysis (t-Distributed Stochastic Neighbor Embedding). This mathematical approach reduces complexity and reveals similarities in high-dimensional data, such as transcriptomic or proteomic data. From the Dana Pe’er lab https://www.c2b2.columbia.edu/danapeerlab/html/phenograph.html
Read more about proteomic analysis in
N. R. Gough, Single-Cell Proteomics Shines Light on the Complexity of Immune Cells in Solid Tumors. BioSerendipity (28 June 2017) hhttps://www.bioserendipity.com/single-cell-proteomics-shines-light-on-the-complexity-of-immune-cells-in-solid-tumors/.

