I have been monitoring the predictions for Maryland along with the actual data reported for Maryland for COVID-19. I have focused my attention on deaths and hospitalizations, because most other data are so incomplete or inaccurate that I don’t consider them reliable. What I have seen is encouraging and suggests that the steps Governor Hogan and the citizens of Maryland have taken are working to slow the spread of COVID-19.
I consider the official start of social distancing to be when schools were closed on March 16, 2020. However, I personally implemented social distancing before then. I started social distancing at the beginning of March once I saw how the SARS-Cov2 virus was spreading from China into Europe. I even debated whether I should attend a conference for a client on the last Friday of February. Although I did attend that conference, I did not shake hands with anyone and I sat as far as I could from the other conference attendees. It was only a matter of time before it was firmly established in the US and living in a part of the country with a lot of international travel meant that the disease and the virus would be in Maryland. I wrote my first article about social distancing on March 10.
In addition to closing the schools on March 16, steps that Governor Hogan took to encourage social distancing included closing non-essential services on March 23 and issuing a stay-at-home order on March 30.
Several places have developed models to predict the outcomes based on effective social distancing and stay at home efforts. Two that I have used are the ones from Institute for Health Metrics and Evaluation (IHME) and Covid Act Now. What I like about the IHME models are that they include the uncertainty range. This means that they report both the most likely values and the upper and lower predictions from their models. Covid Act Now presents only the most likely values.
A difficult aspect to understanding the output of the models is that the results change over time. Sometimes the models change, meaning that the equations for calculating the results are modified based on new information. Sometimes, the results are updated using new input data but calculated using the same equations as were used before. This means that on any given day, the graphs can look different if they have been updated since previously viewed. In hindsight, I wish I had downloaded the data for each update, so I could see how the information was changing.
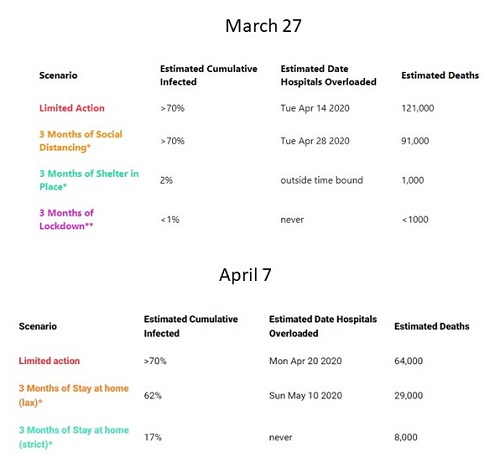
One change that was readily obvious to me is that the peak of infection keeps moving later in time. This is an indication that the interventions are working to reduce the speed that the virus is moving through the population and is exactly what would be expected if the interventions are working. This is evident by comparing the predictions from the Covid Act Now model for March 27 and April 7 (Figure 1). The peak moved from April 14 to April 20 in the limited action scenario and from April 28 to May 1o in the social distancing (referred to as lax stay at home in the April 7 version). These predicted dates of hospital overload reflect peaks of infection.Another piece of encouraging data is the reduction in estimated deaths from March 27 to April 7 even in the limited action scenario. The increase in deaths in the 3 months stay at home scenario likely reflect the increase in total percentage of Marylanders that are predicted to become infected in the results from April 7.

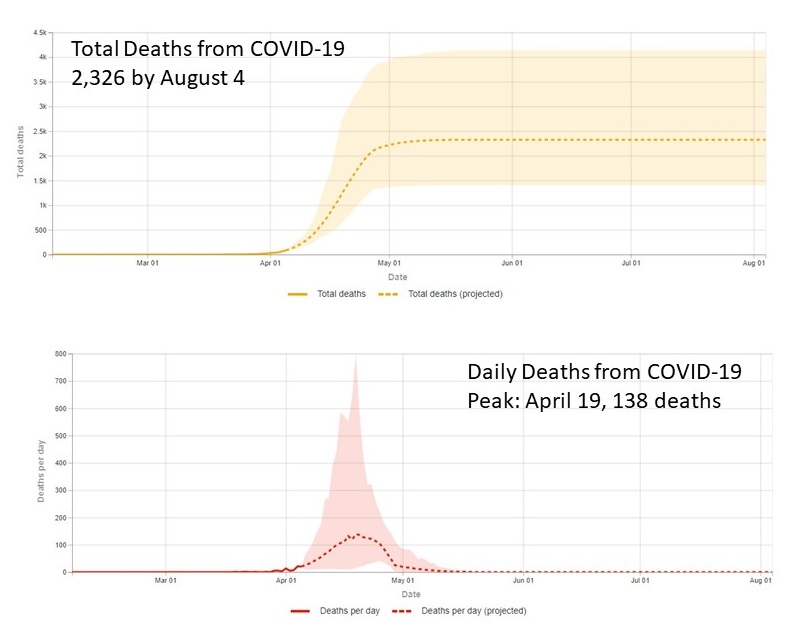
The IHME and Covid Act Now models are different, so the predicted results are different. The data from IHME are presented in an interactive format, so that each day’s data can be inspected (Figure 2). With the IHME model, the predicted values compared to the actual values are very encouraging. The predicted total COVID-19 death toll for Maryland for April 7 was 142 with a range of 100 to 210. The reported deaths as of April 7 are 103. This suggests that Maryland is on track to minimize the deaths from COVID-19 from the steps implemented.

I find the data encouraging, despite the wide variations in predicted outcomes from these two sources. Marylanders should continue following the stay-at-home order, practice social distancing when in public places with other people, and wash hands frequently. People in other states and countries should be similarly encouraged by how effective these measures appear to be and should strive to implement them.
Update 9 April 2020:
Predicted death totals for April 9: 161 (range of 129 – 213)
Actual death totals for April 9: 138
Cite as: N. R. Gough, Social distancing is working in Maryland. BioSerendipity (7 April 2020) https://www.bioserendipity.com/social-distancing-is-working-in-maryland/.
Also of interest
N. R. Gough, Social distancing can save your life and someone else’s. BioSerendipity (10 March 2020) https://www.bioserendipity.com/social-distancing/

